







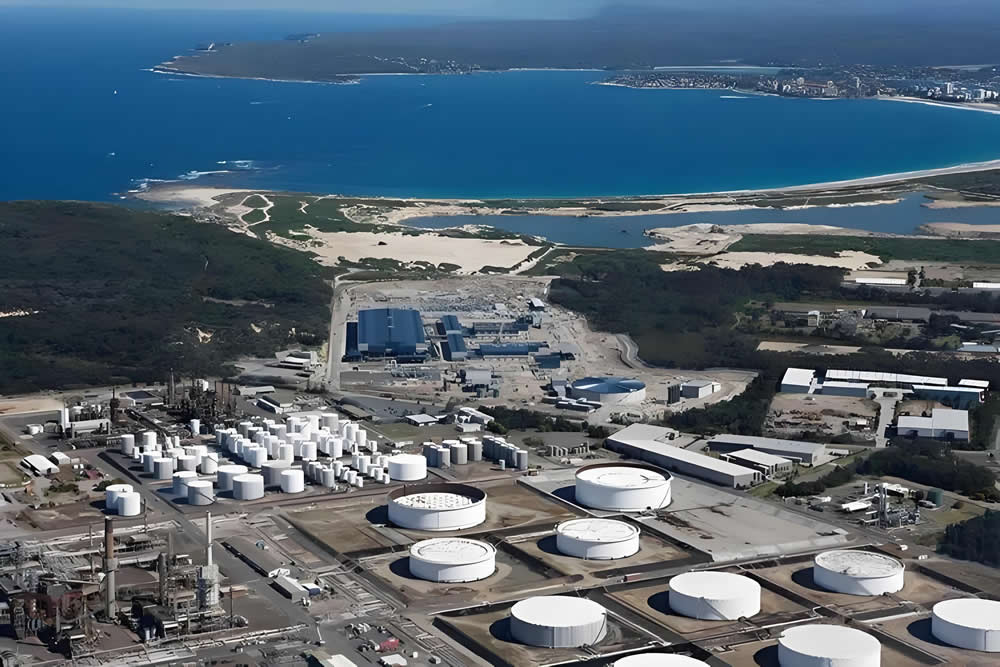
seawater desalination
Current status of seawater desalination:
The global daily output of seawater desalination is about 35 million cubic meters, of which 80% is used for drinking water, solving the water supply problem of more than 100 million people, that is, 1/50 of the world’s population relies on seawater desalination for drinking water. According to statistics from the International Desalination Association, there are about 18,000 seawater desalination plants in 150 countries and regions around the world, among which reverse osmosis (RO) is one of the main membrane technologies for removing dissolved salts and other impurities from ocean or groundwater sources.
Average water consumption and cost of supply by seawater desalination at US$1 per cubic metre (±50%)
| Area | Consumption Litre/person/day | Desalinated Water Cost US$/person/day |
| US | 378 | 0.38 |
| Europe | 189 | 0.19 |
| Africa | 57 | 0.06 |
| UN recommended minimum | 49 | 0.05 |
Key Stages of Seawater Desalination
Modern seawater desalination plants primarily use reverse osmosis (RO) technology to convert seawater into freshwater. During this process, parameters such as pH, conductivity, turbidity, and dissolved oxygen (DO) need continuous monitoring. Stable readings are crucial for detecting scaling, corrosion, and membrane fouling—all of which directly impact system performance and maintenance costs.Key parameters that must be monitored include:
- Conductivity / Salinity: To gauge how effectively salt is removed and to detect changes in feed or brine streams.
- pH: Affects corrosion control, chemical dosing, membrane life.
- Turbidity / Suspended Solids: High turbidity can exacerbate fouling of membranes or filters.
- Dissolved Oxygen (DO) / ORP: For biological growth / corrosion control, especially in intake or post-treatment zones.
- Temperature (often measured but indirectly via effect on membranes).
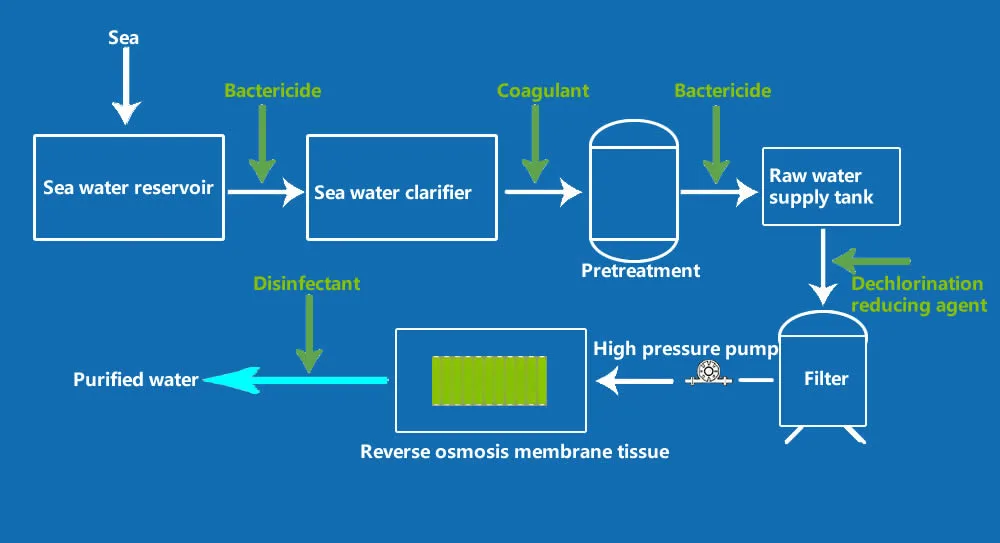
Why water quality monitoring is vital in seawater desalination?
Membrane Fouling Cost
- Membrane fouling remains one of the largest operational cost drivers in membrane-based desalination. One comprehensive review shows fouling raises operating costs because higher pressures are required to maintain permeate flux and membranes must be cleaned or replaced more often. ResearchGate
- The cost of membrane elements themselves contributes only ~6%-8% of the total water cost produced in a seawater RO system; the major cost contributions come from pretreatment, energy, cleaning, downtime. membranes.com
- Another study of full-scale installations found that fouling cost (cleaning, labor, reduced membrane life) is significant though hard to quantify; still, the implication is clear: better monitoring leads to less fouling -> lower cost. api.kwrwater.nl
Quality Monitoring Reduces Risk & Improves Efficiency
- Real-time monitoring of turbidity or conductivity helps detect feedwater quality excursions before they cause performance drops or membrane damage. For example, one review of organic fouling in RO desalination indicated that online monitoring and prediction of fouling formation is a key conclusion. MDPI
- Given the global desalination capacity is increasing at ~7% per year (or more) and the market expanding rapidly, plants must improve automation, reduce manual testing, and ensure water quality stability. EU Blue Economy Observatory
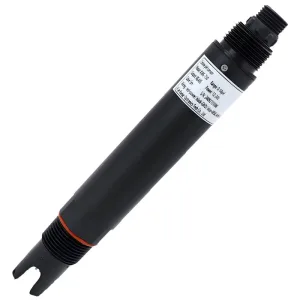
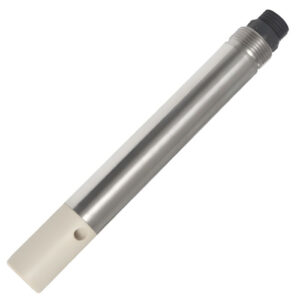
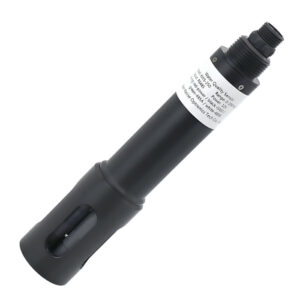
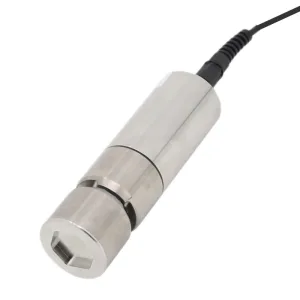
Implication for sensors: Sensors that provide accurate, stable, low-maintenance readings for pH, conductivity, turbidity, DO — with robust design for high salinity, fouling, marine environment — are of high value. When integrated into online monitoring platforms, they enable earlier detection, condition-based maintenance, and optimization of chemical dosing.
Related Products




Improving Seawater Desalination Plant Performance
While proprietary client data may not always be publicly documented, we can outline a realistic scenario based on industry patterns:
A seawater desalination facility experiences frequent membrane cleanings every ~4 months due to feedwater turbidity spikes and biofouling. The downtime, chemical cost, and replacement add up to substantial OPEX. By installing a suite of online sensors (pH, turbidity, conductivity) on the intake and post-pretreatment modules, the plant implements a monitoring dashboard with alerts. They detect a turbidity rise 12 hours earlier than before, enabling them to adjust feed rate or coagulant dosing. Over the next 12 months:
- Membrane cleaning interval extended from ~4 months to ~6 months.
- Chemical cleaning cost reduced by ~20-30%.
- Membrane replacement deferred by ~1 year representing cost savings.
- Improved water recovery rate (from e.g., 50% to 52%) due to better feed stability.
Though hypothetical, it aligns with trends: sensors enabling predictive maintenance reduce fouling risk, which directly lowers operational cost and improves water output.


